The online advertising market is experiencing continuous, significant growth each year. More and more companies are now allocating a significant portion of their marketing budget for online advertising, over traditional methods, mainly for the following three reasons:
It is easy to track online advertising campaign performance
Companies can easily create customized advertising campaigns for specific audience groups
It is easy to make changes to online campaigns than to traditional advertising campaigns
Our infographic "Global Online Advertising Spending Statistics" covers the latest online advertising trends, internet Ad spending (by regions), global online Ad spending and growth (per year), online advertising market share and lots more
Infographic by - GO-Globe Ecommerce Oman
Infographics by GO-Globe Web Design Mucat
To Publish this Image on your Blog or Website . Copy this code
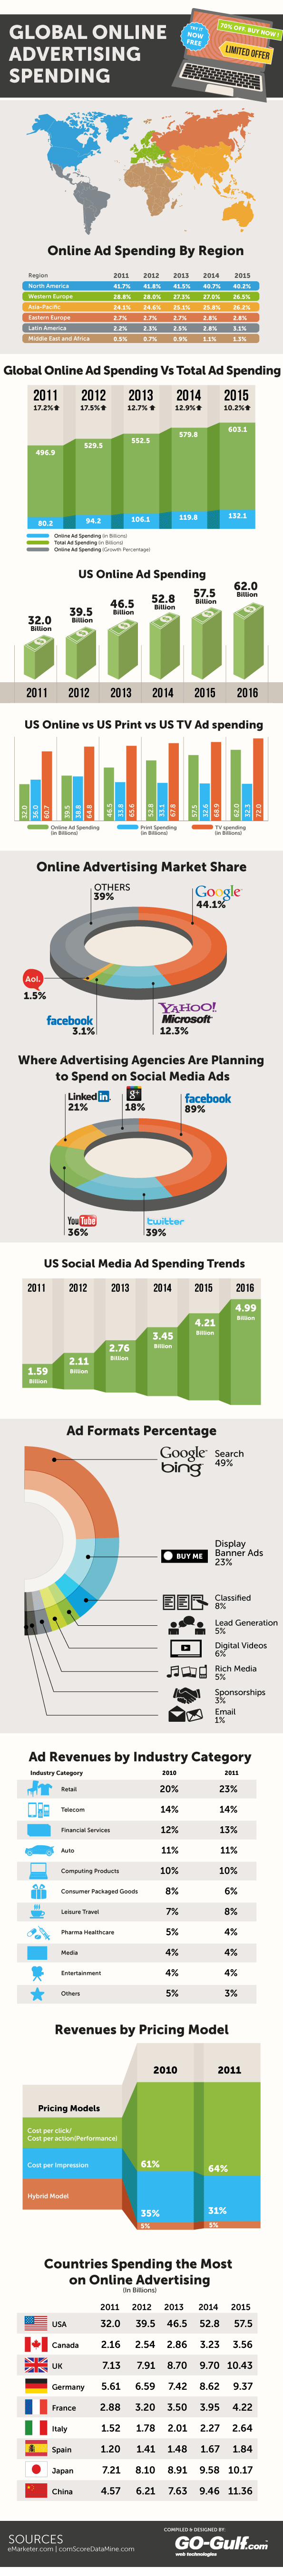
Global Online Ad Spending Statistics
Global Online Ad Spending By Region
| Region | 2010 | 2011 | 2012 | 2013 | 2014 | 2015 |
| North America | 40.8% | 41.7% | 41.8% | 41.5% | 40.7% | 40.2% |
| Western Europe | 30.0% | 28.8% | 28.0% | 27.3% | 27.0% | 26.5% |
| Asia-Pacific | 23.9% | 24.1% | 24.6% | 25.1% | 25.8% | 26.2% |
| Eastern Europe | 2.7% | 2.7% | 2.7% | 2.7% | 2.8% | 2.8% |
| Latin America | 2.1% | 2.2% | 2.3% | 2.5% | 2.8% | 3.1% |
| Middle East and Africa | 0.4% | 0.5% | 0.7% | 0.9% | 1.1% | 1.3% |
US Online Ad Spending Figures
| Year | Ad Spending (in Billions) | Growth %age |
| 2011 | 32.0 | 23.0% |
| 2012 | 39.5 | 23.3% |
| 2013 | 46.5 | 17.7% |
| 2014 | 52.8 | 13.5% |
| 2015 | 57.5 | 8.9% |
| 2016 | 62.0 | 7.8% |
US Online vs US Print vs US TV Ad Spending
| Online Ad Spending (In billions) | Print Spending (In billions) | TV spending (In billions) | |
| 2011 | 32.0 | 36.0 | 60.7 |
| 2012 | 39.5 | 38.8 | 64.8 |
| 2013 | 46.5 | 33.8 | 65.6 |
| 2014 | 52.8 | 33.1 | 67.8 |
| 2015 | 57.5 | 32.6 | 68.9 |
| 2016 | 62.0 | 32.3 | 72.0 |
Online Advertising Market Share
| Internet Properties | Market Share |
| 44.1% | |
| Microsoft + Yahoo | 12.3% |
| 3.1% | |
| AOL | 1.5% |
| Others | 39% |
Where Advertising agencies are planning to spend their Money
| Social Media Ad Platform | Percentage |
| 89% | |
| 39% | |
| You Tube | 36% |
| 21% | |
| Google+ | 18% |
US Social Media Ad Spending Trends
| Year | Ad Spending (in Billions) |
| 2011 | 1.59 |
| 2012 | 2.11 |
| 2013 | 2.76 |
| 2014 | 3.45 |
| 2015 | 4.21 |
| 2016 | 4.99 |
Ad Formats Percentage
| Ad Format | Percentage |
| Search | 49% |
| Display Banner Ads | 23% |
| Classified | 8% |
| Lead Generation | 5% |
| Digital Videos | 6% |
| Rich Media | 5% |
| Sponsorships | 3% |
| 1% |
Ad Revenues by Industry Category
| Industry Category | 2010 | 2011 |
| Retail | 20% | 23% |
| Telecom | 14% | 14% |
| Financial Services | 12% | 13% |
| Auto | 11% | 11% |
| Computing Products | 10% | 10% |
| Consumer Packaged Goods | 8% | 6% |
| Leisure Travel | 7% | 8% |
| Pharma Healthcare | 5% | 4% |
| Media | 4% | 4% |
| Entertainment | 4% | 4% |
| Others | 5% | 3% |
Revenues by Pricing Model
| Pricing Models | 2010 | 2011 |
| Cost per click/Cost per action(Performance) | 61% | 64% |
| Cost per Impression | 35% | 31% |
| Hybrid Model | 5% | 5% |
Countries spending the most in Online Advertising (In Billions)
| 2011 | 2012 | 2013 | 2014 | 2015 | |
| USA | 32.0 | 39.5 | 46.5 | 52.8 | 57.5 |
| Canada | 2.16 | 2.54 | 2.86 | 3.23 | 3.56 |
| UK | 7.13 | 7.91 | 8.70 | 9.70 | 10.43 |
| Germany | 5.61 | 6.59 | 7.42 | 8.62 | 9.37 |
| France | 2.88 | 3.20 | 3.50 | 3.95 | 4.22 |
| Italy | 1.52 | 1.78 | 2.01 | 2.27 | 2.64 |
| Spain | 1.20 | 1.41 | 1.48 | 1.67 | 1.84 |
| Japan | 7.21 | 8.10 | 8.91 | 9.58 | 10.17 |
| China | 4.57 | 6.21 | 7.63 | 9.46 | 11.36 |